
Much has been made in recent years about Diversity, Equity, and Inclusion (DEI). While I am not an expert in this field and will make no claims about the validity of any particular policy claiming to further DEI-initiatives, I will put forward a way to empirically test the results of such programs.
In this project, I use Bayesian probability to show how an organization can test whether its policies have actually achieved its own DEI objectives.
To demonstrate this, we will seek to use a Human Resources dataset detailing 311 unique employees belonging to the same organization to determine the posterior probability of an employee being a manager in that organization given that the employee belongs to one of six unique race descriptions. This will show us how the organization’s DEI policies may or may not have affected the composition of its management team. An organization’s management team is a powerful vehicle for change and one tasked with setting the trends for the institution’s future. If DEI is not actualized in management, this author would argue that it has failed.
Before we discuss this, however, we’ll give a brief overview of Bayesian probability. We’ll then conduct an experiment with sample data, use the posterior probabilities to draw inferences, and discuss how this can be applied to real world institutions.
I know this topic is a divisive one, which admittedly, is why I chose to work on it. If you’re in the camp that embraces (at least some) DEI-initiatives, you should be interested in results. You should care about whether or not your aims are met and how well as a means to advocate for them. If you’re in the camp that opposes (at least some) DEI-initiatives, you should likewise be interested in determining their effect and using the results in arguing against them and their effectiveness.
Whether or not DEI initiatives have the impact they claim is a testable hypothesis and one which I intend to demonstrate. Both advocates and opponents should rely on demonstrable reasoning to further their aims.
Truth exists independently of our beliefs and the minds we used to conceive of the world around us. Reasoning and inference are the only tools we have to decide between truth and falsehood.
The Dataset
This project uses the Human Resources Data Set from Dr. Richard A. Huebner and Dr. Carla Patalano [1].
The dataset contains fields for 311 unique employees. Used in this demonstration are the Position and RaceDesc (“Race Description”) fields.
The logic used in this project can easily be applied to other fields such as Sex, MaritalDesc, CitizenDesc, etc.
Background on Bayesian Probability
The probability used in this project is based on Bayes’ Theorem:
[math]P(A|B) = \dfrac{P(B|A) \times P(A)}{P(B)}[/math]
This means that the probability of A given B (that is, P[A|B]) is a function that multiplies the probability of A (P[A]) times the probability of B given A (P[B|A]) marginalized over the probability of B (P[B]).
The technical details of how and why this works is beyond the scope of this discussion. Suffice it to say, for a non-technical reader, that the probabilities we end up with as a result of Bayes’ Theorem are conditional: that is, the probabilities we seek (for example: the probability of being a manager in an organization) are conditional of some prior state (for example: being African American). Thus, we do not ask simply “What proportion of our employees are managers?” or “What proportion of our employees are African American?” but rather more compelling (and more revealing) “What proportion of our employees are managers given that they are African American?”
As we shall see, these three questions have very different answers. It is only the latter of these, the question that puts into account prior states, that really cuts at the heart of what we are trying to solve.
Why These Questions Matter
A proponent of DEI policies will wish to know the answer to the questions posed in this demonstration.
For instance, it is not sufficient merely to say that “X% of employees are of Y description”. It is very possible for, say, 55% of employees to belong to some group of concern, say, LGBTQ+. That would make a majority of employees of this description. However, it is also possible, given this same workforce composition, that 80% of management are not LGBTQ+.
But given that someone either A) is LGBTQ+ or B) is not, what are the probabilities that they are in management? Being LGBTQ+ is a prior state.
These questions can only be answered by Bayesian probability. Once answered, we will know that given whether someone falls into either camp what their likelihood of being in management is. From this, we can draw inferences about the composition of our workforce and about whether the organization believes it is headed in the right direction insofar as its DEI policies are concerned.
Sample Experiment: What is the Probability that an Employee is a Manager Given that He or She is X Race?
What We Are Seeking to Find
Using Bayes’ Theorem, we can compute the probability that an employee is a manager given that he or she belongs to a certain category, such as a specific race.
This means that, provided an employee already belongs to a certain racial group, what is the posterior probability that that employee is a manager?
Thus, the precise question we wish to answer is: “What is the probability that an employee is a manager given that he or she belongs to X racial description?”
For instance, we might ask, “what is the probability that an employee is a manager given that he or she is Black or African American?”
What Is a “Manager” in Our Dataset?
The dataset has 32 unique positions (i.e., job titles). Of these, we consider 13 of them to be “managers”.
These 13 manager positions are:
Area Sales Manager
BI Director
CIO
Director of Operations
Director of Sales
IT Director
IT Manager – DB
IT Manager – Infra
IT Manager – Support
President & CEO
Production Manager
Sales Manager
Shared Services Manager
The probability that a given employee holds any one of these positions is given in Table 1, below:

What “Races” Are Described in Our Dataset?
Our dataset has six race descriptions:
American Indian or Alaska Native
Asian
Black or African American
Hispanic
Two or more races
White
The probability that a given employee belongs to one of these race descriptions is shown in Table 2, below:

Posterior Probabilities
With these figures, we can then compute the probability that a given employee is a manager given that he or she belongs to a certain race description. We call these the posterior probabilities because they are the probabilities that result from Bayes’ Theorem after we have taken into account employees’ management status given their belonging to the various race descriptions.
The results of these computations are shown in Table 3, below:

Inference
What do these posterior probabilities (shown in Table 3, above) mean?
Let us first consider the incorrect way of thinking about this issue before we discuss the inferences that could be drawn from the correct view.
Incorrect Reasoning
The incorrect way of thinking about the issue of DEI policy effects on racial group representation in management is to ask (and answer) only one of the following questions:
- “What is the probability that an employee is a manager?”
- “What is the probability that an employee belongs to a given race description?”
- “What is the probability that an employee belongs to a given race description given that he or she is a manager?”
The answer to the first question simply tells us about the proportion of our workforce that is in management (whether this proportion is too high or too low is an independent issue).
The answers to the second question (that is, one answer per race description) tells us only how each race group is represented in our workforce (again, a separate issue).
The answers to the third question, while seemingly similar to what we are looking for has it backwards: we want to know—given that an employee already belongs to a certain race description—what the probability of that same employee being a manager is, and not what the third question (above) asks: given that an employee is already is a manager what the probability for that same employee being of a certain race description is. Question 3, above, is like asking “if the employee is manager, what is the probability that he or she is Black or African American?” when we should be asking, “if the employee is Black or African American, what is the probability that he or she is a manager?”
The distinction is vitally important. We want to know what the chances of being a manager are for each race description, not what the chances of being in a certain race group given that one is already a manager. What we are investigating is potential bias that might favor the organization promoting someone because of their race description. One belongs to the group describing his or her race description before and independently of his or her job title, not the other way around.
Correct Reasoning
Table 3, reproduced again below, answers the questions we have about the organization’s management makeup: that is “if the employee belongs to X race description, what is the probability that he or she is a manager?”
There is, surprisingly, only one employee that belongs to the Hispanic race description and that employee is a manager, therefore, the posterior probability of being a manager given that one is Hispanic is 1.0000 in this organization (a result that would most likely not hold up had the dataset contained more than one Hispanic employee).
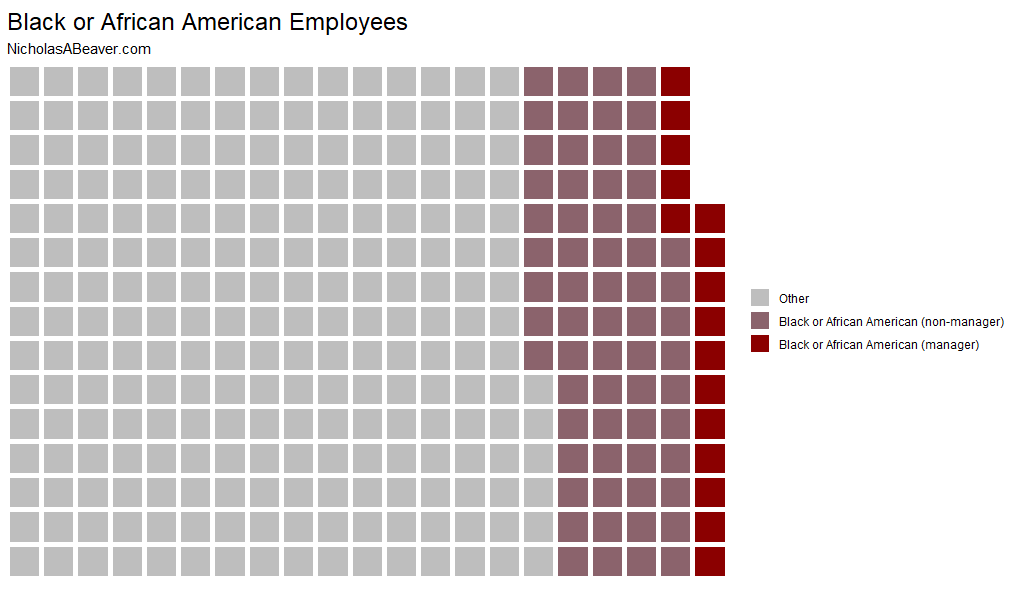
Taking the Black or African American race description as a salient example, we see that the probability of being a manager given that one is Black or African American is 0.2000.
This can be visualized in Figure 1, below:
Figure 1. A Visualization of Black or African American Employees from the Dataset.

Bayes Factors
One way to think about this issue is in the form of Bayes Factors (BF’s). We can compute a BF’s as a ratio between each race description’s posterior probability and the posterior probability of each other race description, including the total for all employees. This gives us how much more (or less) likely a given race description is to be a manager when compared to each other group.
This is shown in Table 4, below.

Looking at Table 4, we see for example that an employee that is Two or More Races is 4.3939 times as likely as an Asian employee to be a manager. Likewise, according to Table 4, a White employee is 0.3743 times as likely than a Black or African American employee to be a manager.
These BF’s could likewise be computed as ratios comparing the figures from Table 3 with the organization’s industry average or the averages for the entire regional, national, or international population. These would likewise give us factors showing the odds of how these race descriptions compare to others from other organizations or from society as a whole.
In short, Table 4 is a prime example of how the organization can see how well its DEI policies have fared in their actual implementation; in other words, what the real effects have been on the composition of the workforce.
Conclusions & Further Work
The organization represented by the dataset has a high number of non-Whites in management which leads to a high posterior probability of the non-White race descriptions being in management.
The Bayes Factors (BFs) show the comparison, as ratios, of one race descriptions posterior probability compared to each other race description and to the organization as a whole.
Whether or not the organization’s goals are met as part of its DEI efforts are yet to be determined. The organization may wish for parity between groups, to emulate population averages, or perhaps achieve some other objective. Computing the posterior probabilities and computing Bayes Factors gives the organization the tools to see how well its efforts have fared.
If the organization looks for parity, its BFs between groups should be as close to 1 as possible; this means that the posterior probability of an employee being a manager given that they belong to a particular race description is even across the board, regardless of the employee’s race description.
If, however, the organization wishes to emulate some industry or societal average, the BFs can be computed to compare the posterior probabilities of each race description to these industry or societal averages; again, figures close to 1 mean that there is little difference between the organization’s posterior probabilities and that of the industry or society as a whole.
While we focused on race and management status in this project, it is entirely feasible to do these computations for gender, age, income, etc. A wide-ranging DEI audit using Bayesian probability is entirely possible, computing posterior probabilities and Bayes Factors for a host of dimensions.
An organization could also track these metrics over time to see where its efforts are leading it: either closer or further away from its stated aims.
Without these computations an organization claiming to support DEI initiatives is flying blind. Either the organization does not have the knowhow and reasoning to apply these principles or else it’s obfuscating the truth, perhaps speaking with a silver tongue while burying its head in the sand.
In a future demonstration, I will use this same dataset to test the same institution’s pay fairness based on both race and gender.
References
- Dr. Richard A. Huebner, and Dr. Carla Patalano. (2020). Human Resources Data Set [Data set]. Kaggle. https://doi.org/10.34740/KAGGLE/DSV/1572001