
College tuition has been on the rise for decades in the United States. These costs have quickly outpaced inflation, or the general rise in prices experienced in the broader economy. [1]
So how much should parents set aside and invest for their children’s college expenses? What does the picture look like? Are these goals even achievable, financially?
This project answers these questions by providing estimates on what parents would need to save and invest over the course of 18 years to afford the average estimated tuition and fees.
What We’re Attempting to Answer
The precise question we’ll seek to answer in this project is:
“If I have a child born in January 2026, how much will I have to invest per month to fully fund college for that child at an average U.S. public four-year institution?”
A Three-Step Process
We will take three steps toward determining how much we need to save and invest to meet our child’s college education needs:
- Estimate future costs for college.
- Estimate rates of return for our investments.
- Based on these estimates, calculate the monthly contribution we must make to meet our goal.
For Step 1 and Step 2, we will generate three estimates: an “optimistic” estimate, an average estimate, and a “pessimistic” estimate. These estimates will then serve to create a 9×9 Contribution Matrix. This matrix will tell us how much our monthly contribution must be to meet our college tuition goal given an intersection of cost and investment return estimates.
Our 9×9 Contribution Matrix will look like the table below (the final product will, of course, be filled in).

Assumptions
To simplify our work, we’ll make a few assumptions:
- We will estimate only the costs of tuition and fees (not room and board, etc.).
- We will not take into account grants, scholarships, etc.
- We will estimate costs for a four-year public institution only.
- Our child is born January 2026 and will attend four years of college starting with the 2044-45 academic year in September.
- All investments are held tax-free in a 529 Plan.
- The portfolio composition is a blend of stocks, bonds, and cash with a target date.
- We will not simulate (a la Monte Carlo) sequence of returns, but only several possible cost and return scenarios.
- All estimates are in nominal dollars.
With these assumptions in mind, we move onward to Step 1.
Step 1: Determine Future Costs for College
To estimate the future cost of our child’s college education, we first evaluate past tuition fees. Using data from the National Center for Education Statistics we find that the average tuition costs for four-year public intuitions in the United States rose from $295 per year in the 1968-69 academic year to $7,998 in the 2022-23 academic year (the latest data available at this time of this writing). [2]
The price trend is shown in Figure 1, below.

Using Equation 1, below, we compute the geometric mean of the increase over these 55 (n = 55) periods (from 1968-69 to 2022-23).
\begin{equation}
\text{Geometric Average Rate} =
\left(\frac{\text{Ending Value}}{\text{Starting Value}}\right)^{\frac{1}{n}} – 1
\tag{1}\label{eq:geom}
\end{equation}
We find that the geometric average rate of increase from 1968-69 to 2022-23 was 6.1836%.
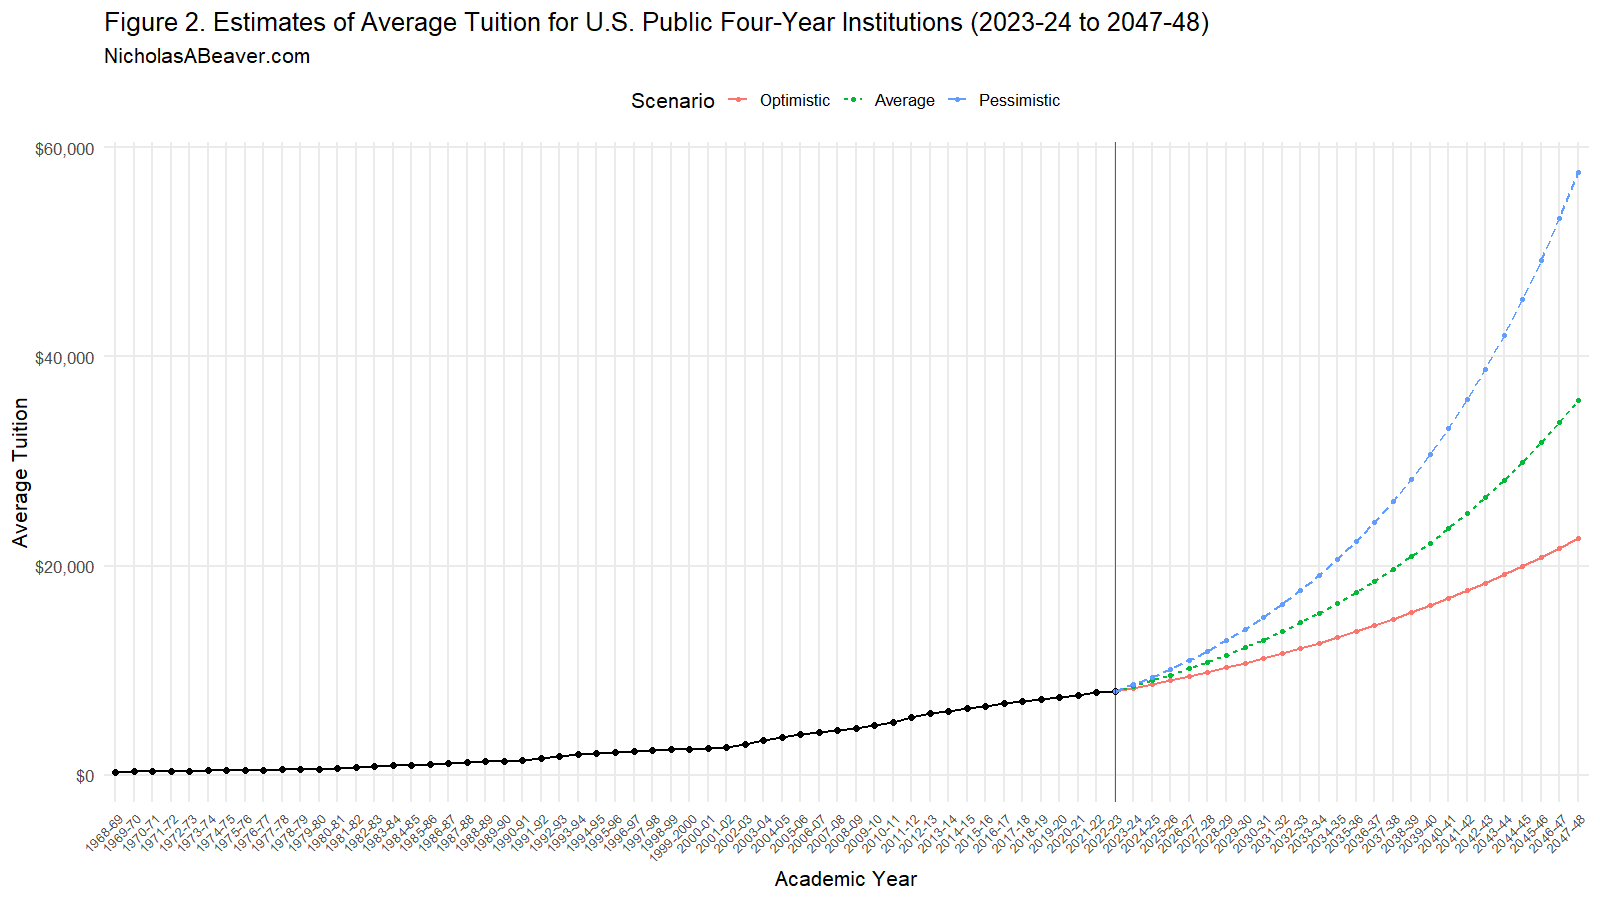
This value will serve as just one estimate of cost for our final 9×9 Contribution Matrix. To find a “pessimistic” and “optimistic” cost increase, we evaluate the 33 eighteen-year rolling periods from the academic years 1968-69 to 2022-23. The lowest increase for any 18-year rolling period (the “optimistic” estimate) and the highest increase for any 18-year rolling period (the “pessimistic” estimate) appear alongside the average estimate for the entire 55-period dataset in Table 1, below.

Using these estimates, we can visualize the estimated increase of tuition costs over the projected period for each of the three scenarios. This is shown in Figure 2, below.

With our cost estimates in hand, we move onward to Step 2.
Step 2: Determine Rate of Return for Investments
The portfolio we choose for this investment plan is from Vanguard. Vanguard offers a wide selection of Target Enrollment Plans designed specifically for 529 plans like ours. [3] While as of this writing, Vanguard does not offer a plan quite as far out into the future as we require (enrollment in 2044-45) we can look at something very similar: Vanguard Target Enrollment 2042/2043 Portfolio. [4]
In the Vanguard 2042/2043 portfolio, we see that it is comprised of the following four assets [5] [6] [7] [8]:

While Vanguard does not publish exactly how it manages its portfolios in their prospectuses, the idea behind such “target date” funds it to gradually rebalance the portfolio so that over time, as the target date nears, more volatile assets like stocks are traded in for less volatile assets such as bonds. Vanguard uses a rebalancing process that keeps funds within a target window, rebalancing only when funds deviate from the portfolio’s target composition. [9] Sadly, Vanguard does not tell us what its target compositions are, in advance, for each year of the target date fund.
Using the current compositions of this 2042/2043 portfolio, which is near the outset of the fund’s launch, we model a prospective 2044/2045 portfolio that Vanguard will offer us. We expect the rebalancing of the portfolio to follow a linear trend, assuming annual rebalancing as shown in Figure 3, below:

The prospective 2044/2045 target enrollment portfolio is assumed to begin with a 60/40 combination of the Total Stock Market Index Fund (VTSAX)/Total International Stock Index Fund (VTIAX) and end with a 70/30 combination of the Total Bond Market II Index Fund (VTBIX)/Total International Bond Index Fund (VTIFX). This means that our model will start with a 60/40 mix of VTSAX/VTIAX and gradually decrease these holdings, trading them in for a final 70/30 mix of VTBIX/VTIFX, year by year, achieving the mix shown in Figure 2, above, for each year of investment.
Calculated returns for each period will be based, in part, on the portfolio composition described above.
To determine the rate at which each fund is expected to grow, we look to the historic returns for each fund. Each of the four funds publishes its average 10-year returns, which are summarized below, in Table 3, along with the expense ratio Vanguard charges annually for administering the fund.

Using these returns and the respective funds’ expense ratios, we end up with three arrays of estimated returns for each of the 213 periods from January 2026 to September 2044 when our child will enroll in college.
A selection of these arrays is shown below, on Table 4.

These arrays give us average estimated monthly return estimates for our portfolio. To generate an “optimistic” scenario we increase these returns by 25% and to generate a “pessimistic” scenario, we decrease these returns by 25%.
Table 5, below, shows us the expected returns, minus expenses and fees, expected for each scenario.

Our calculations take into account not just the fund expense for each separate fund, but the additional 0.14% expense ratio for administering the entire portfolio.
With these in hand we move lastly to Step 3.
Step 3: Calculate Required Monthly Contribution
Now that we have our three cost estimates (Optimistic, Average, and Pessimistic) and our return estimates (Optimistic, Average, and Pessimistic), we can calculate the monthly contribution we must make to meet our investment goal.
We must calculate C, the contribution, as a function of the FV (future value, that is, the estimated tuition cost) divided by the sum of periods times the product of all rates of return for each period.
This is described by Equation 2, below.
\begin{equation}
FV = C \sum_{t=1}^{n} \left( \prod_{j=t+1}^{n} R_j \right)
\quad \Longrightarrow \quad
C = \frac{FV}{\displaystyle \sum_{t=1}^{n} \left( \prod_{j=t+1}^{n} R_j \right)}
\tag{2}
\end{equation}
Using our three estimates for costs and three estimates for rate of return, we perform the calculation from Equation 2 for all nine projected scenarios. The results of these calculations are shown on Table 6, our 9×9 Contribution Matrix, below.

Conclusion
This project sought to answer the question: “If I have a child born in January 2026, how much will I have to invest per month to fully fund college for that child at an average U.S. public four-year institution?”
Our results were visualized in a 9×9 Contribution Matrix that took an intersection of three estimates of future college costs (“Optimistic”, “Average”, and “Pessimistic”) and three estimates of investment returns (“Optimistic”, “Average”, and “Pessimistic”) for our portfolio.
The Average-Average (that is “Average” cost estimate and “Average” investment returns) estimate tells us that we would have to save and invest $376.77 per month in our Vanguard portfolio to reach our goal.
The Contribution Matrix helps us better visualize the range of likely scenarios, based on our modeled assumptions, that we could expect. If we’re cautious, we may assume Pessimistic-Pessimistic, Pessimistic-Average, or Average-Pessimistic. Likewise, if we’re more confident in the future we might assume instead Optimistic-Optimistic, Optimistic-Average, or Average-Optimistic.
The color-coding of the Contribution Matrix helps us further understand the interrelationship these estimates have on our required investment contributions. Greener is a more optimistic picture of the future, leading us to require less in the way of investment contributions, while redder is more pessimistic, requiring us to invest more per month. Yellow, of course, lies in the middle, and is perhaps the single best estimate, given our assumptions, of what should be contributed to such an investment plan to meet a child’s future tuition needs.
References
- Brock, M. (2025). How Much Has College Tuition Outpaced Inflation. SoFi Learn. April 14, 2025. Retrieved November 5, 2025 from https://www.sofi.com/learn/content/college-tuition-inflation/
- United States Department of Education, National Center for Education Statistics. (2024). Table 330.10 — Average undergraduate tuition, fees, room, and board rates charged for full-time students in degree-granting postsecondary institutions, by level and control of institution: Selected academic years, 1963-64 through 2022-23 [Data table]. Digest of Education Statistics. Retrieved November 4, 2025, from https://nces.ed.gov/programs/digest/d23/tables/dt23_330.10.asp?current=yes
- Vanguard (n.d.). Vanguard 529 plan portfolios. Retrieved November 4, 2025, from https://investor.vanguard.com/investment-products/list/529-portfolios?filters=open
- Vanguard (n.d.). Vanguard Target Enrollment 2042/2043 Portfolio. Retrieved November 4, 2025, from https://investor.vanguard.com/accounts-plans/529-plans/profile/w361#portfolio-composition
- Vanguard (n.d.). Vanguard Total Stock Market Index Fund Institutional Select Shares. Retrieved November 4, 2025, from https://investor.vanguard.com/investment-products/mutual-funds/profile/vstsx#overview
- Vanguard (n.d.). Vanguard Total International Stock Index Fund Institutional Select Shares. Retrieved November 4, 2025, from https://investor.vanguard.com/investment-products/mutual-funds/profile/vtisx#overview
- Vanguard (n.d.). Vanguard Total Bond Market II Index Fund Institutional Shares. Retrieved November 4, 2025, from https://investor.vanguard.com/investment-products/mutual-funds/profile/vtbnx#performance-fees
- Vanguard (n.d.). Vanguard Total International Bond Index Fund Institutional Shares. Retrieved November 4, 2025, from https://investor.vanguard.com/investment-products/mutual-funds/profile/vtifx#performance-fees
- Vanguard (2024). The rebalancing edge: Optimizing target-date fund rebalancing through threshold-based strategies. December 2024. https://corporate.vanguard.com/content/dam/corp/research/pdf/the_rebalancing_edge_optimizing_target_date_fund_rebalancing_through_threshold_based_strategies.pdf